

Ryan O’Hanlon
Multiple Authors
Last year seemed like the worst-case scenario.
Pretty much everything went wrong for Tottenham Hotspur. Everyone got hurt. They were incredibly unlucky in close games — they scored 64 goals and conceded 65 — and they also eventually stopped caring about the Premier League, instead pushing all of their focus into winning the Europa League, which they did.
And so Tottenham, the ninth-richest soccer club on Earth, according to Deloitte, finished last season in 17th place in their own domestic league. Even still, they were never in danger of relegation. They landed 12 points clear of 18th-place Leicester City, and their goal differential was a cool 46 goals better than the Foxes.
It seemed to prove that the “Big Six” clubs in England really are too big to fail. This, after all, is why those teams are worth billions of dollars and everyone else could be bought for a couple hundred million dollars.
Well, it turns out that things can, in fact, always get worse. With nine games remaining this season, Spurs are just one point clear of 18th place, the relegation zone. They still have to go to Anfield to face Liverpool and to Stamford Bridge to face Chelsea, and they host Nottingham Forest, who are tied for 18th on points, toward the end of this month.
Prediction models, betting markets, and vibes all tell us the same thing: there is a very real chance that Tottenham will be relegated and find themselves playing in the Championship next season.
That would be a historic, borderline-unthinkable disaster, and it would have to be the worst Premier League season of the modern era … right? Let’s find out.
– The Premier League is boring now — here’s how to fix it
– Top 50 USMNT players of 2026, ranked by club form
– Do Premier League summer transfers need more patience?
Determining the Premier League’s ‘worst’ teams
One of the main problems with the Premier League — both broadly and from an analysis standpoint — is that the game is rigged. Not everyone has the same amount of money to spend, so it’s unfair to simply judge Manchester City’s point total directly against Brentford’s. No, we need to control for the money each team spends, and then compare it to some kind of expected performance level.
That’s what we did here. First, I looked at the estimated market value from Transfermarkt for every Premier League roster since the 2010-11 season. These numbers tend to correlate very highly with the amount of money each team spends on its players. Then, I looked at each season individually and calculated an expected point total based on the relationship between points won and a team’s market value in each particular season.
So, to come up with these rankings, I simply compared every team’s actual point total with their expected point total. The following teams are the 10 sides who finished the farthest below their expected projection.
10. Manchester United, 2024-25
• Expected points per game: 1.57
• Actual points per game: 1.1
In Sir Alex Ferguson’s final three years with the club, Manchester United overperformed their expected point totals by an average of 0.23 points per game — or nearly nine points per season. Since then, they’ve underperformed by around 0.09 points per game, or about 3.5 points per season.
That number doesn’t seem as low as it should be, but just think of all the “Manchester United are back” articles you’ve read over the past decade. Soccer is a random sport, and United always have talented rosters, so they’ve still had some spike seasons amid the general decline. The question for the future, then, is: Are we just experiencing more of the same?
Last season was United’s worst in the dataset, while this season so far would be United’s best. Now, that’s largely because their roster is only estimated to be the sixth-most valuable in the league right now, but we’ve seen this story before.
Is the club building toward some longer-term success, or is this just another upward blip amid a longer story of terminal decline?
9. Southampton, 2022-23
• Expected points per game: 1.21
• Actual points per game: 0.7
Stats Perform has shot-stopping data going back to the 2018-19 season. And by “shot-stopping” data, I mean that they look at where every shot ended up on the goal frame, calculate the likelihood that each shot would be scored, and then compare the combined goal probability of all the shots a keeper faced to how many goals he actually conceded.
These numbers are incredibly noisy from season to season, but goalkeeper Gavin Bazunu’s 2022-23 season with Southampton was the worst in the dataset:
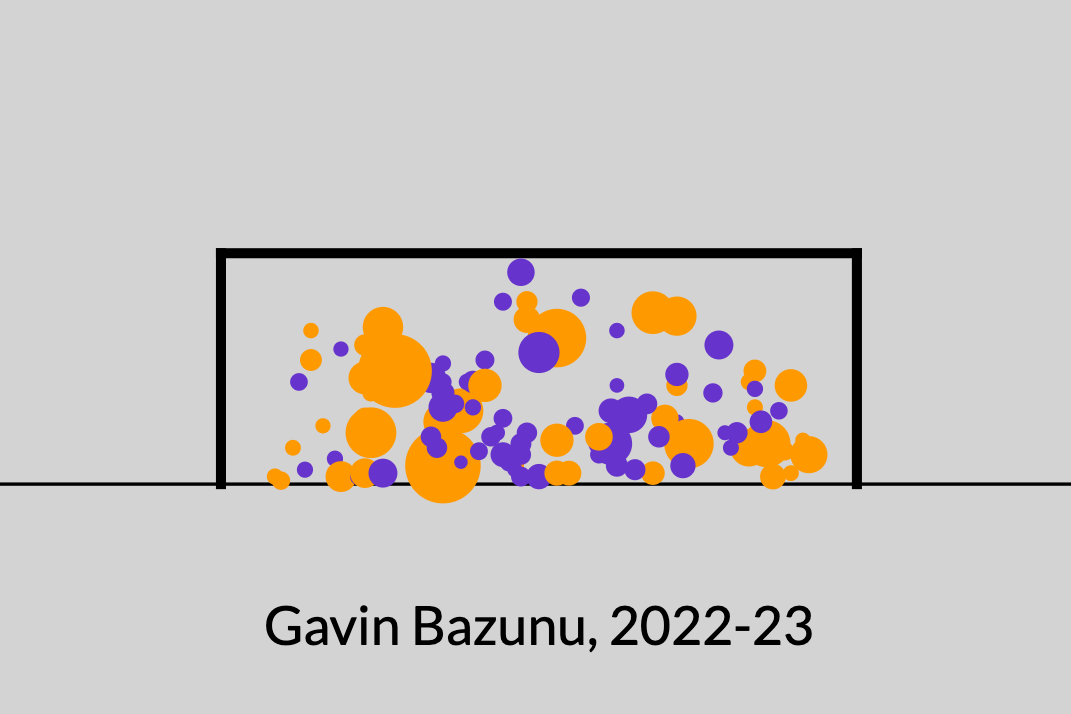
Orange dots are goals, purple dots are shots, and the bigger dots mean higher xG, or expected goals, per attempt. He was expected to concede 35.42 goals. He conceded 52.
8. Huddersfield Town, 2018-19
• Expected points per game: 0.92
• Actual points per game: 0.4
At the time, Huddersfield’s 16 points and minus-54 goal differential were both league worsts since 2010. Those totals have both been matched and exceeded multiple times since, but I can’t imagine we’ve seen the following record matched, or if we’ll see it matched any time soon: Huddersfield’s leading non-penalty goal scorers were Mathias Jorgensen and Karlan Grant, with three each.
7. Chelsea, 2015-16
• Expected points per game: 1.82
• Actual points per game: 1.3
Chelsea have 16 seasons in this database, and they’ve exceeded their expected point total … one time.
Funnily enough, it was the 2014-15 season, when they cruised to a Premier League title under Jose Mourinho and then completely imploded the following year. Eden Hazard won Player of the Year with 11 non-penalty goals and nine assists in 2014-15. He scored four times and assisted three goals the next season. Mourinho was fired in the middle of December, and Chelsea finished in 10th place.
Chelsea were owned by a Russian oligarch who spent $2 billion of his own money on the team, and now they’re owned by a group of billionaires who are doing whatever they can under the Premier League’s rules to spend as much money on players as possible. Despite all of that, they’ve only really challenged for a title in two of the past 16 seasons — and they won both times.
6. Tottenham Hotspur, 2024-25
• Expected points per game: 1.52
• Actual points per game: 1.0
It might not seem like it, but Spurs have actually developed a pretty consistent performance pattern. Or, at least, they had developed a pretty consistent performance pattern.
Here’s how their non-penalty expected-goals differential stacks up across every full season since 2010:
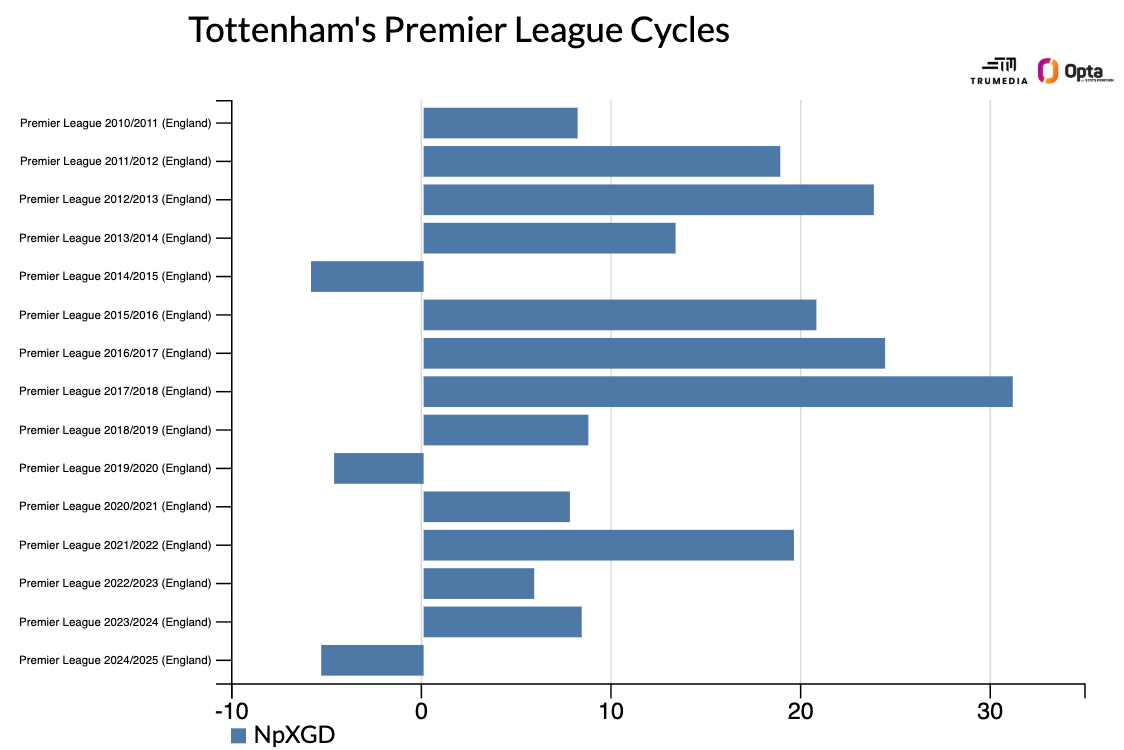
It’s four good years, followed by one down year, followed by four good years, and so on.
Given that Tottenham have mostly been a selling club in the modern era, this trend makes sense. They acquire a bunch of good young players, they have a four-year run together (the average length of a player’s prime), and then they either leave for bigger, richer clubs or they stay and get worse. Then it all happens again.
The concerning parts are that the most recent “peak” was quite low, during an era when Tottenham had finally established themselves as one of the richest teams in the world. Even more concerning, the chart doesn’t include the current season …
5. Wolverhampton Wanderers, 2025-26
• Expected points per game: 1.07
• Actual points per game: 0.5
The concept of “form” tends to be meaningless beyond simply telling us what happened in the recent past. A recent uptick in results doesn’t predict a future uptick in results.
That said, Wolves have won 13 of their 16 total-season points since the turn of the year. Their expected-goal differential over that stretch? Slightly worse than it was before Jan. 1.
4. Tottenham Hotspur, 2025-26
• Expected points per game: 1.62
• Actual points per game: 1.0
It’s really hard to believe we’re here, but the way I’d explain it is through some combination of injuries, a team-building approach that was completely blind to the concept of “passing a soccer ball” as a bedrock skill, and the growing overall competitiveness of the Premier League.
But the wildest part about all of this is that you really can’t blame it on bad luck. If you told me that one of the “Big Six” clubs were legitimately in a relegation battle with fewer than 10 games left, I’d assume that the bounce of the ball was playing a large role. Teams go through season-long finishing and shot-stopping slumps all the time, and presumably you’d need that to happen for a team with Tottenham’s resources to get sucked this deep down the table.
That, though, isn’t happening — at all. Here’s how the league currently stacks up by non-penalty expected-goal differential:
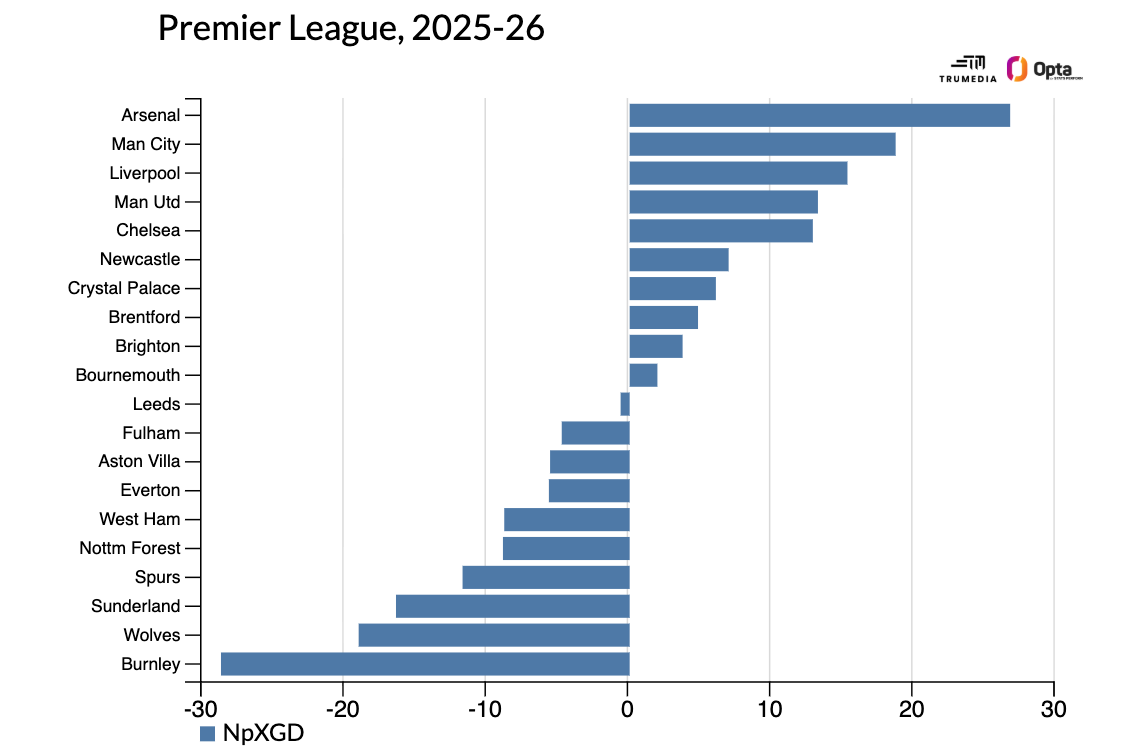
That’s right. With West Ham United and Nottingham Forest ahead of them in that chart, you could make a legitimate argument that Tottenham are lucky to be in 16th place.
3. Southampton, 2024-25
• Expected points per game: 1.05
• Actual points per game: 0.3
Here is the great John Maynard Keynes, talking about soccer tactics:
“For it is in the essence of his behaviour that he should be eccentric, unconventional and rash in the eyes of average opinion. If he is successful, that will only confirm the general belief in his rashness; and if in the short run he is unsuccessful, which is very likely, he will not receive much mercy. Worldly wisdom teaches that it is better for reputation to fail conventionally than to succeed unconventionally.”
OK, fine, he’s talking about investing — but he had might as well be talking about soccer coaches and why they all kind of try to do the same things. Here is a chart that, I think, sums up both the benefits and downsides of being different. It compares the points won with each team’s pass completion percentage outside of the attacking third:
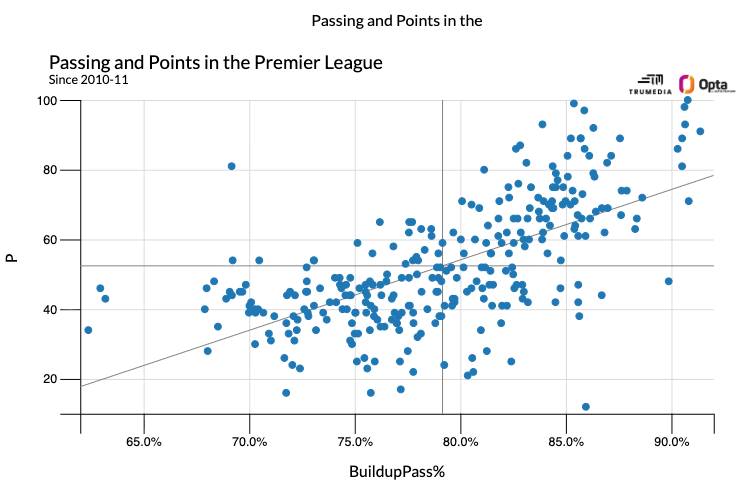
In the upper left and bottom right, you’ll see two massive outliers. The team in the upper left, who eschewed patient passing to a degree that few teams ever have, is Leicester City, who won the Premier League in 2016. And in the bottom right? It’s Southampton, who tried to possess the ball like Manchester City and ended up being one of the worst Premier League teams of all time.
2. Chelsea, 2022-23
• Expected points per game: 1.95
• Actual points per game: 1.2
Chelsea spent over €600 million on transfer fees during Clearlake Capital and Todd Boehly’s first season owning the club. These were the players they brought in:
• Enzo Fernández: €121.00 million from Benfica
• Wesley Fofana: €80.40 million from Leicester
• Mykhailo Mudryk: €70.00 million from Shakhtar Donetsk
• Marc Cucurella: €65.30 million from Brighton
• Raheem Sterling: €56.20 million from Manchester City
• Kalidou Koulibaly: €41.90 million from Napoli
• Benoît Badiashile: €38.00 million from Monaco
• Noni Madueke: €35.00 million from PSV
• Malo Gusto: €30.00 million from Lyon
• Carney Chukwuemeka: €18.00 million from Aston Villa
• Cesare Casadei: €14.86 million from Inter
• Andrey Santos: €12.50 million from Vasco da Gama
• Pierre-Emerick Aubameyang: €12.00 million from Barcelona
• David Datro Fofana: €12.00 million from Molde FK
• João Félix: €11.00 million loan from Atlético Madrid
• Gaga Slonina: €9.09 million from Chicago Fire
• Denis Zakaria: €3.00 million loan from Juventus
Not only was there no immediate success — they fired two managers en route to finishing in 12th place with 44 points — but there’s been very little long-term success, either.
Most of these players are no longer with the club, and only two of them, Enzo Fernández and Marc Cucurella, have started 20 games this season.
1. Aston Villa, 2015-16
• Expected points per game: 1.15
• Actual points per game: 0.4
“Tim Sherwood is at his best when he is backed into a corner.”
-Tim Sherwood
Tim Sherwood said that after managing Villa to a 1-0 loss against West Brom. Backed into a corner, with four points from their first six matches, Villa proceeded to lose their next five matches, and Sherwood was fired. They won only two of their next 27 games and were relegated with what was then the third-lowest point total in league history.
Villa were one of only seven clubs that hadn’t been relegated since the creation of the Premier League. Now, there are six: Manchester City, Manchester United, Liverpool, Everton, Arsenal, Chelsea, and Tottenham.


Leave a Reply